Make a Power BI Chart Readable: Data Labels, a Real Title, Exact Values
Turn Power BI's default column chart into one people can read: check the sort, add data labels, write a real title, and see the exact value behind a rounded label.
- Build the chart
- Data labels
- A real title
- The trap
Step by step
1. Build the chart
Power BI's first chart has a robot title and no numbers on it. Three small changes make it readable.
Load the free sample: Learn with sample data, then Load sample data.
Tick financials, and click Load.
While it loads: this is a small table of sales by month and country, made by Microsoft for practice.
Open the table, tick Sales and Country, and drag the corner to make the chart bigger.
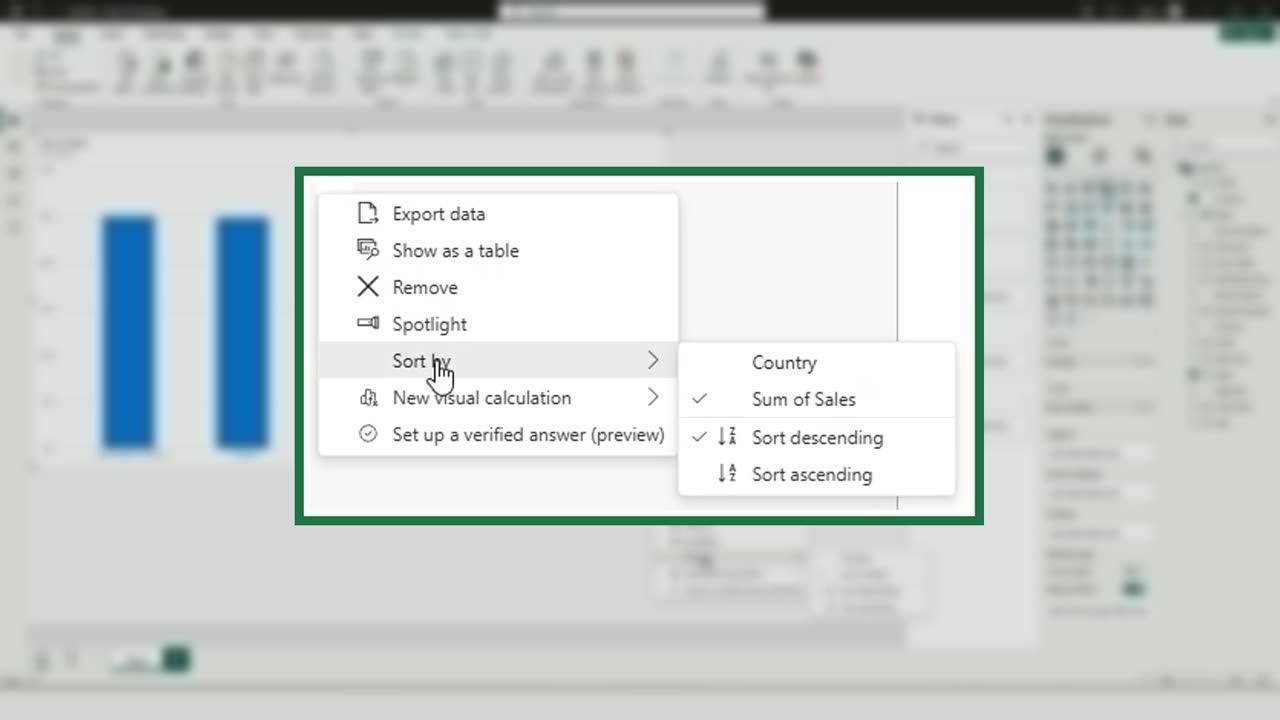
It is already sorted from the largest to the smallest. Check it under the three dots, Sort by.
2. Data labels
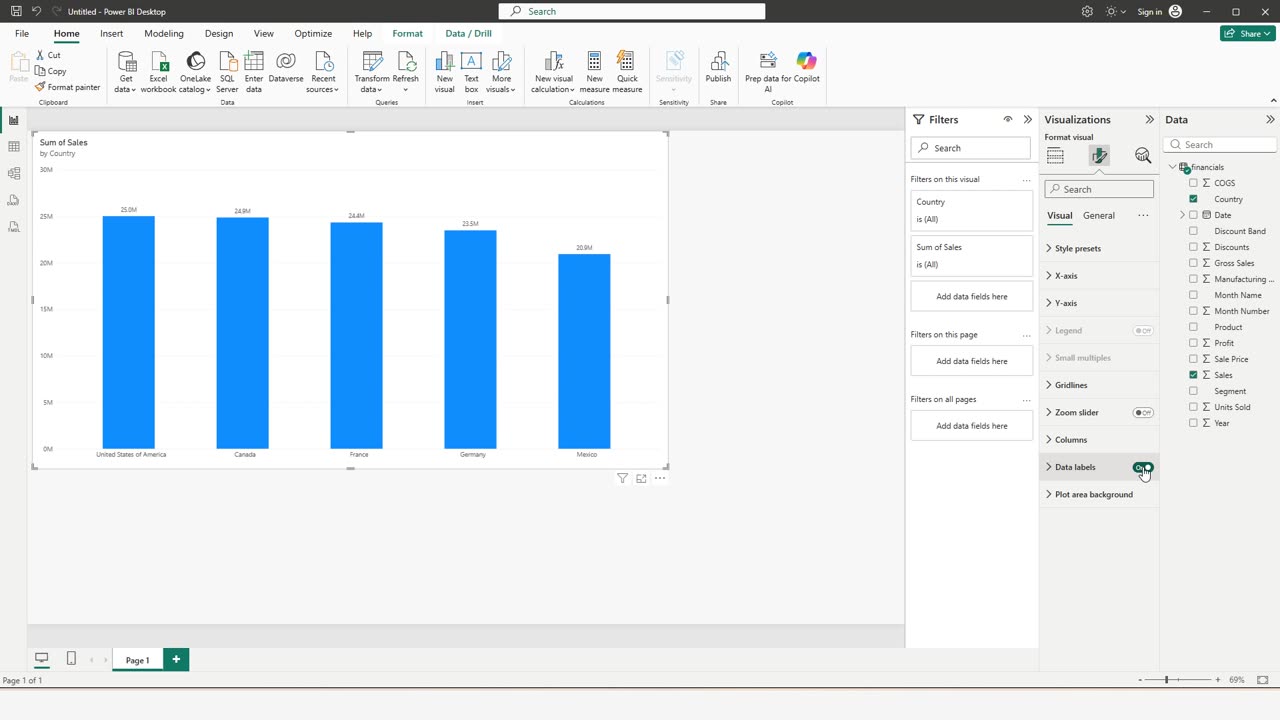
Select the chart, open the Format visual pane, the paint brush, and turn on Data labels.
Now every bar shows its value, rounded to millions.
Quick pause: if your charts are finally readable, a like really helps the channel. One more change, then the trap.
3. A real title
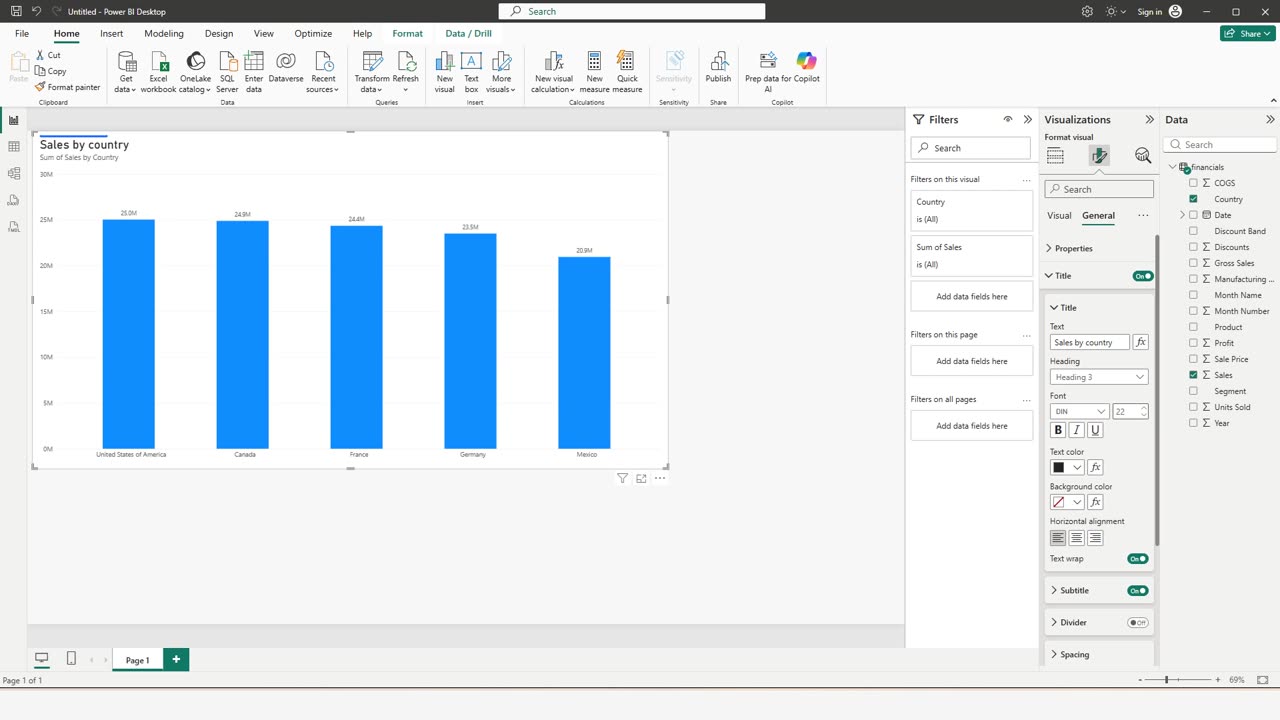
Switch to General, open Title, and type a title people understand.
Make it bigger: font size twenty-two.
4. The trap
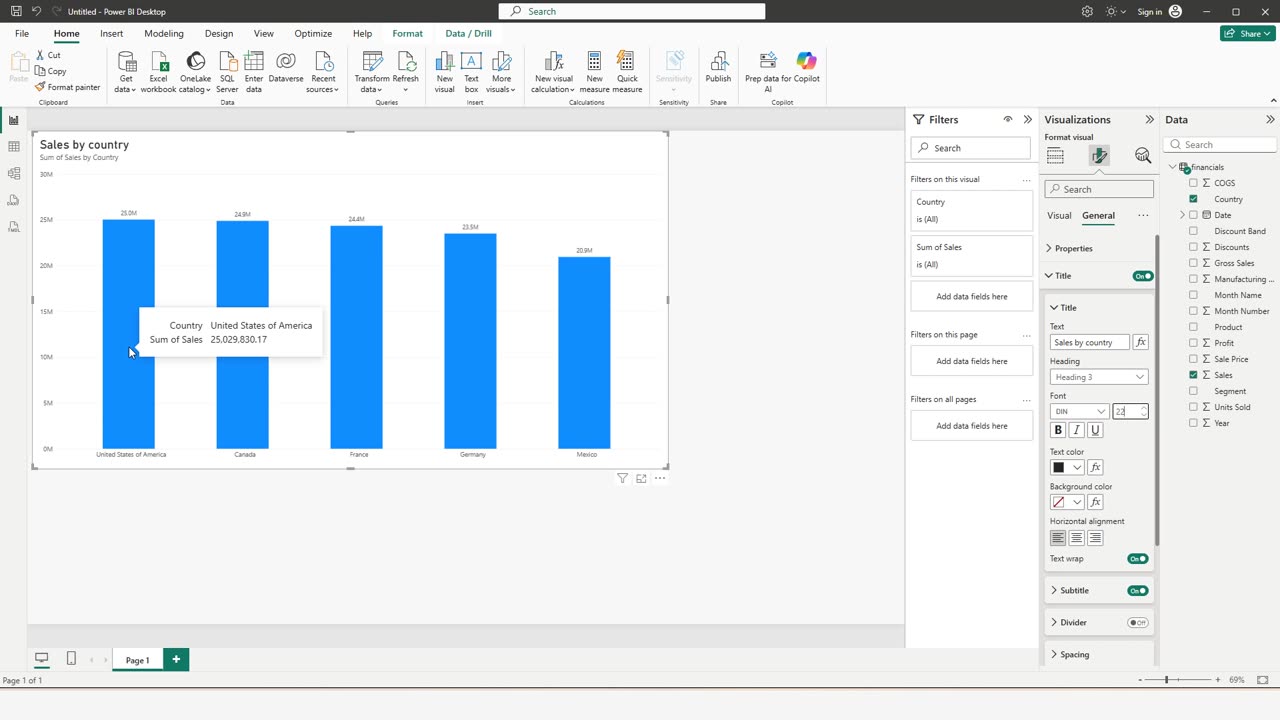
Now the trap: the labels are rounded. Twenty-five point zero and twenty-four point nine million look almost the same.
Point at a bar, and the tooltip shows the exact value, down to the cent.
A clear title, values on the bars, and the exact number one hover away. Tell me in the comments which Power BI chart you want to fix next.
← Previous tutorial: Power BI Date Charts: Drill Up and Down Without Being Fooled
Next tutorial: Meet Copilot in Excel: Your First Prompts →