Power BI Date Charts: Drill Up and Down Without Being Fooled
Build a line chart by date from Power BI's sample data, move through year, quarter, month and day, and spot the incomplete-year trap.
- Load sample data
- Line chart by date
- The trap
Step by step
1. Load sample data
This Power BI chart says sales more than tripled in one year. They did not. Here is how to read a date chart without being fooled.
Power BI comes with free sample data. Click Learn with sample data, then Load sample data.
The Navigator lists the tables in the file. Tick financials, and click Load.
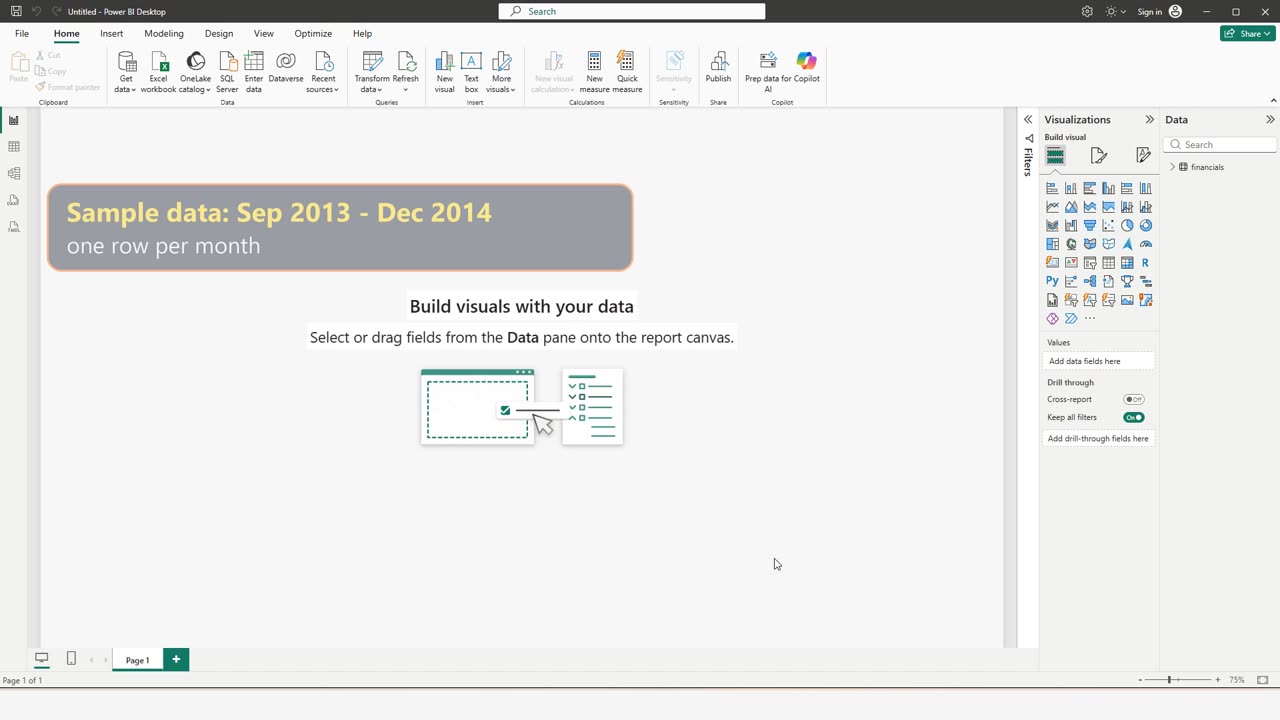
While it loads, one fact to remember: this table has one row per month, from September 2013 to December 2014.
2. Line chart by date
Open the table, tick Sales, and switch the chart to a line chart.
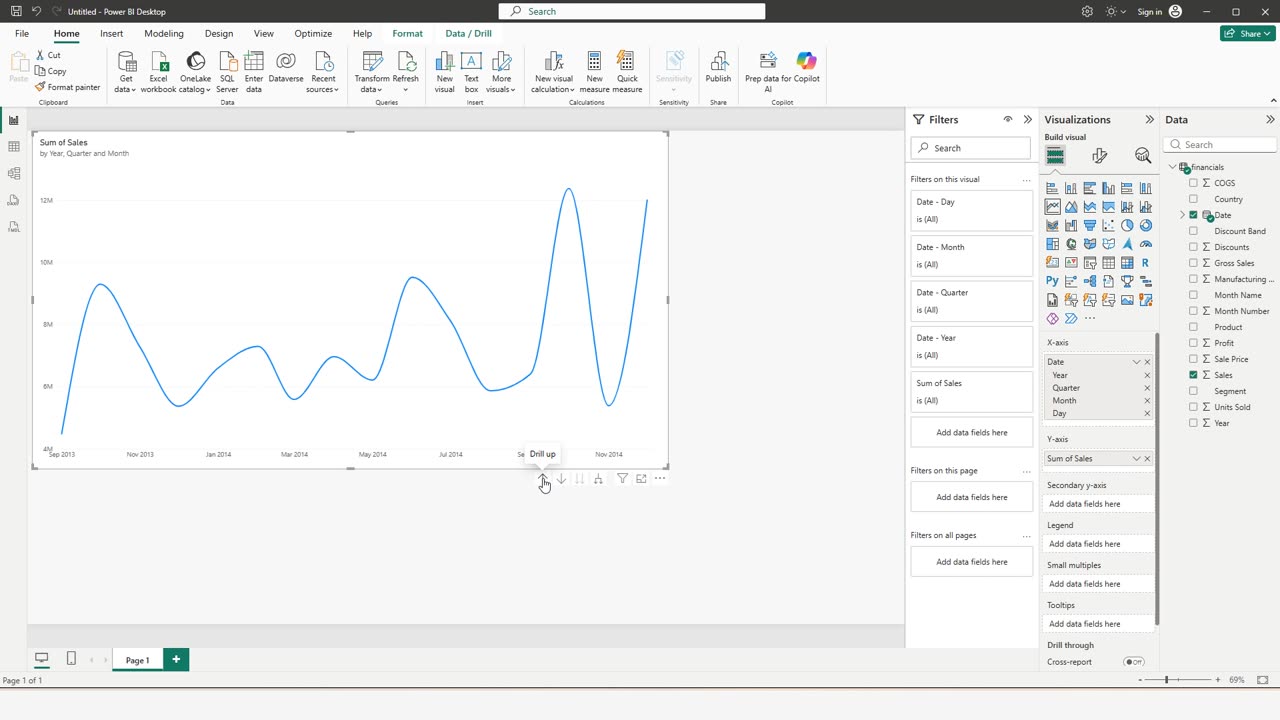
Now tick Date. Power BI puts a whole date hierarchy on the axis: year, quarter, month and day.
Drag the corner to make the chart bigger.
The arrows under the chart move between those levels. Click the up arrow.
The line does not change. With one date per month, days and months are the same thing here.
Quick pause: if date charts ever confused you, a like really helps the channel. The next click is the tricky one.
3. The trap
Click up twice more, all the way to the years.
Sales seem to more than triple from 2013 to 2014. Did they?
No. 2013 has only four months of data, September to December. 2014 has all twelve. The comparison is not fair.
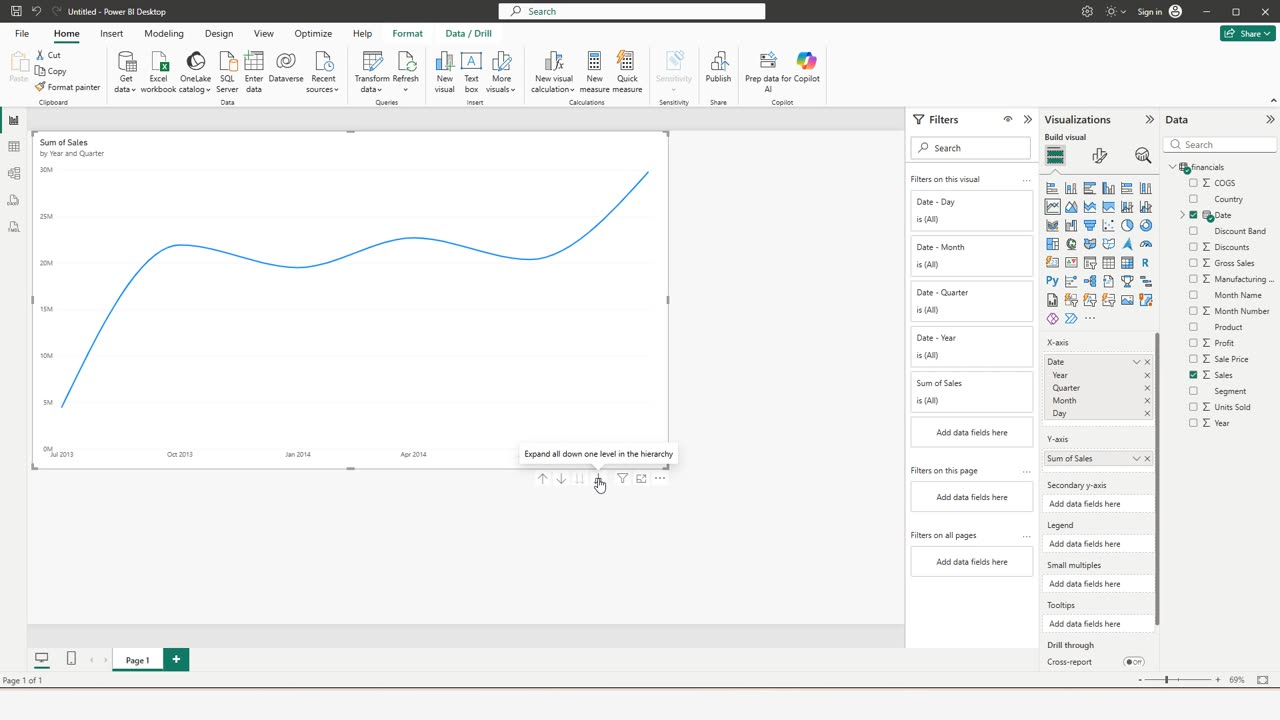
Click the button that expands everything one level down.
By quarter, the picture is fair again. The first point is low only because that quarter holds one month, September.
Before you compare two years, check that both are complete. Tell me in the comments what you want to build next in Power BI.
← Previous tutorial: Your First Power BI Report in 2 Minutes (No Data Needed)
Next tutorial: Make a Power BI Chart Readable: Data Labels, a Real Title, Exact Values →