Your First Power BI Report in 2 Minutes (No Data Needed)
Load Power BI's free sample data, build a column chart, a card and a slicer, and filter everything with one click.
- Load sample data
- Build a chart
- Card and slicer
- Click a bar
Step by step
1. Load sample data
Power BI turns a plain table into an interactive report, and you do not need any data of your own to start.
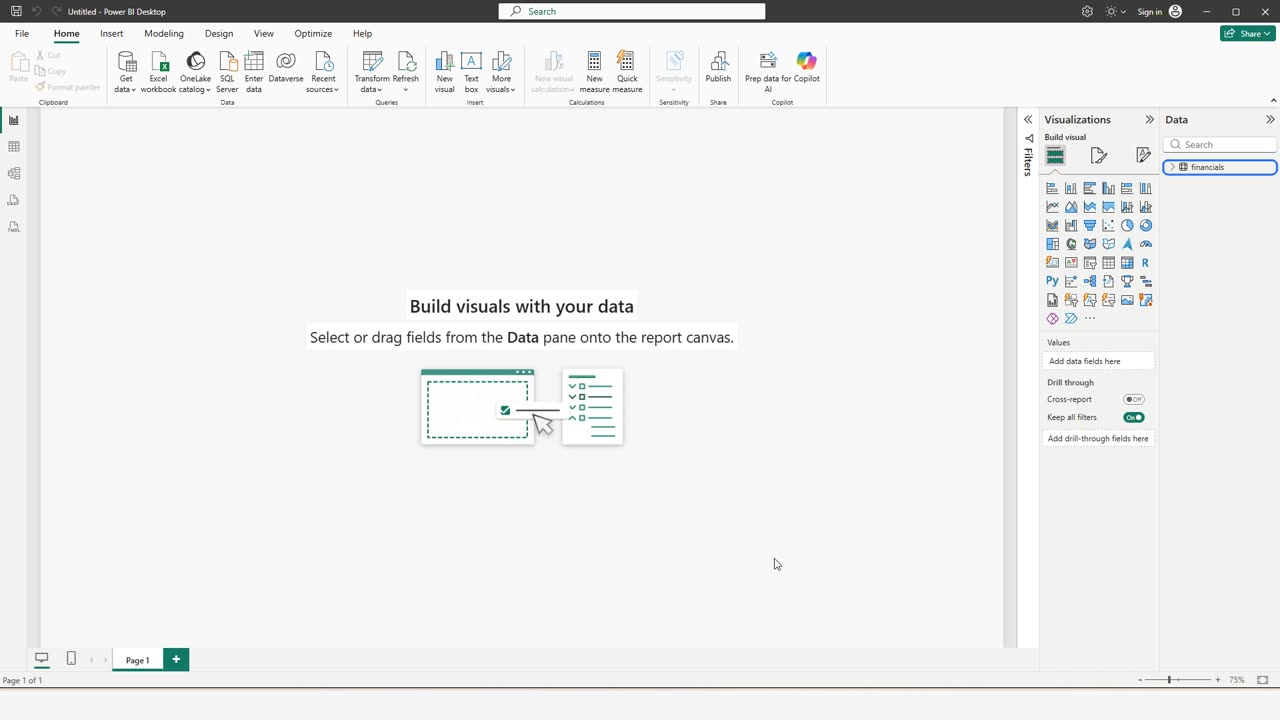
Power BI Desktop is free. When it opens, click Learn with sample data.
Choose Load sample data. It is a small sales table from Microsoft.
The Navigator shows what is inside the file. Tick financials, and a preview appears.
Click Load.
Power BI copies the data into the report. When it is done, the table appears in the Data pane on the right.
2. Build a chart
Open the table to see its columns. The ones with a sigma sign are numbers that Power BI can add up.
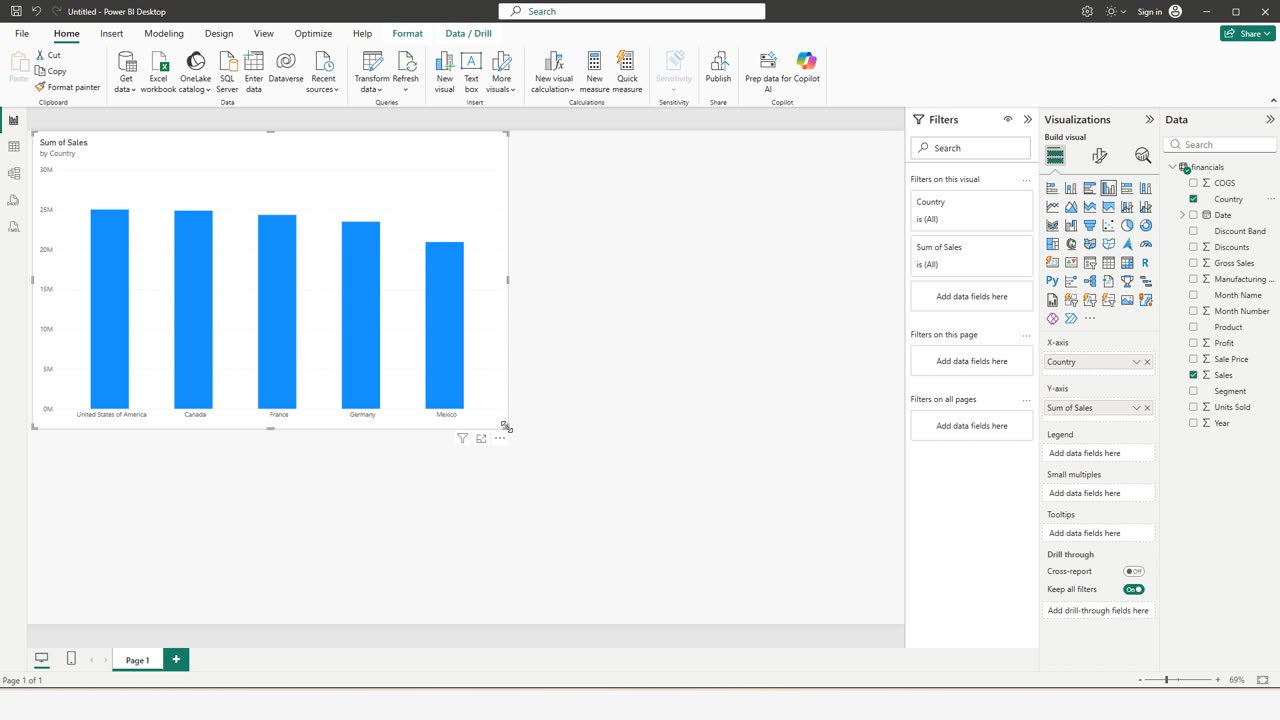
Tick Sales. Power BI makes a chart by itself.
Now tick Country, and the chart shows the sales of every country.
It is small, so drag its corner to make it bigger.
Quick pause: if this is your first Power BI report, a like really helps the channel. Next comes the part that makes it interactive.
3. Card and slicer
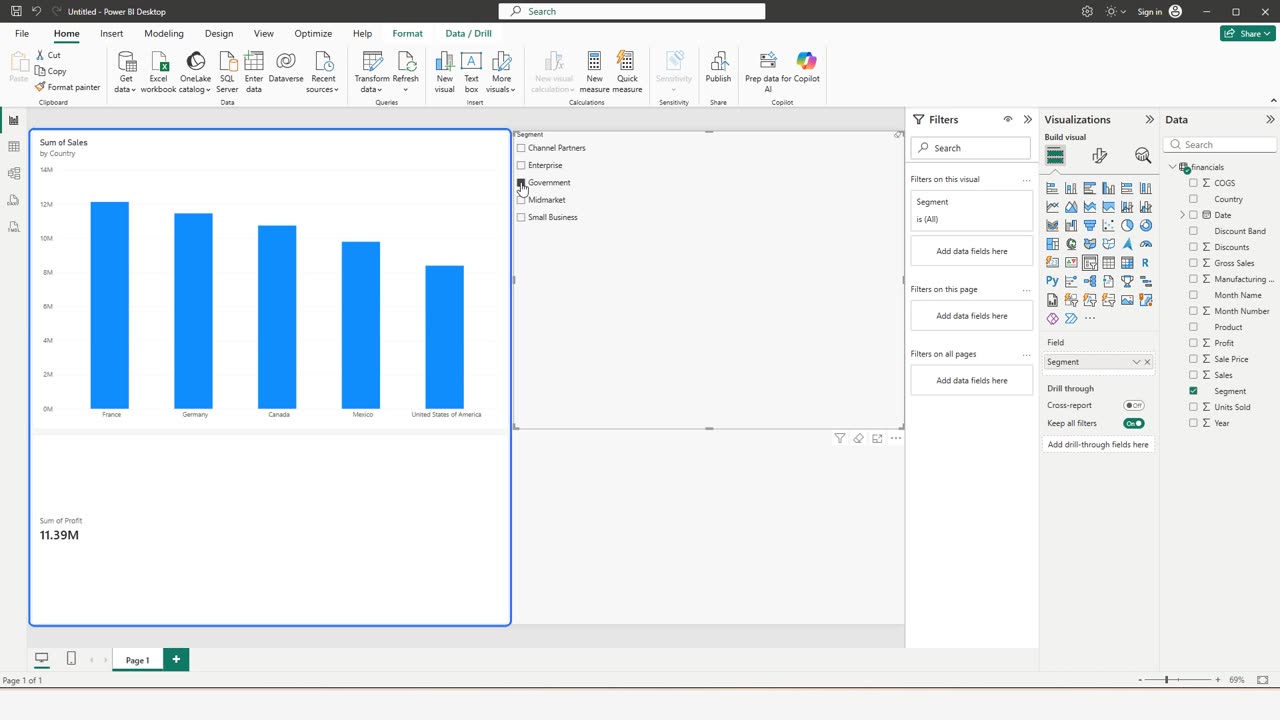
Click an empty spot on the page. Then pick the card visual, and tick Profit.
A card shows one big number: the total profit.
Click an empty spot again, choose the slicer, and tick Segment.
Now click Government. The chart and the card change together.
4. Click a bar
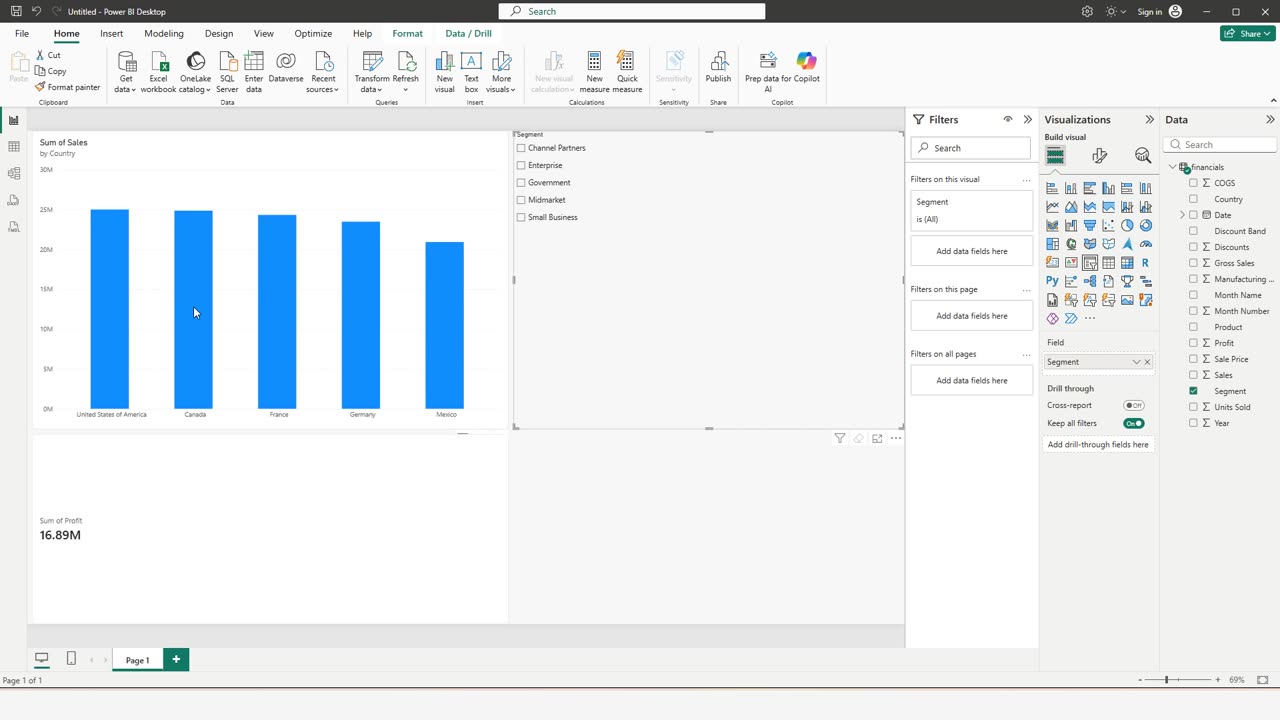
You do not even need a slicer. Click Government again to clear it, then click the Canada bar.
The card now shows the profit of Canada only. Click the same bar again to see everything.
One trap: a column with a sigma is always added up. A sum of years means nothing, so check the title. Here it says Sum of Sales, which is right.
Tell me in the comments which data you want to turn into a report, and the next Power BI video will use it.
← Previous tutorial: Where to Go Next: VBA, Power BI and DAX
Next tutorial: Power BI Date Charts: Drill Up and Down Without Being Fooled →