Build a Simple Excel Dashboard (Beginner Friendly)
Combine PivotTables, charts and slicers into a one-page dashboard.
- One page
- The numbers
- The picture
- The clicks
- Clean it up
- The refresh trap
- Recap
Step by step
1. One page
A dashboard is one page that answers the big questions at a glance, and lets anyone click to dig in. You can build one in five minutes.
Three pieces: a PivotTable for the numbers, a PivotChart for the picture, and a slicer for the clicks.
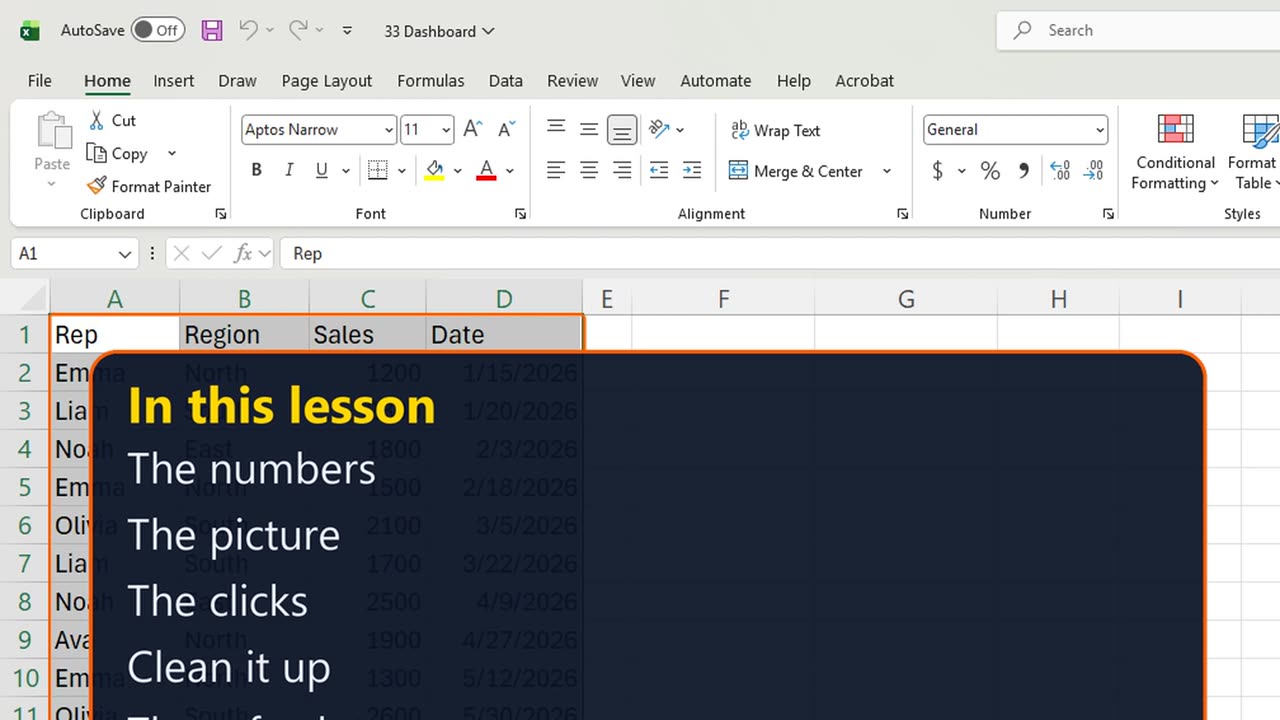
2. The numbers
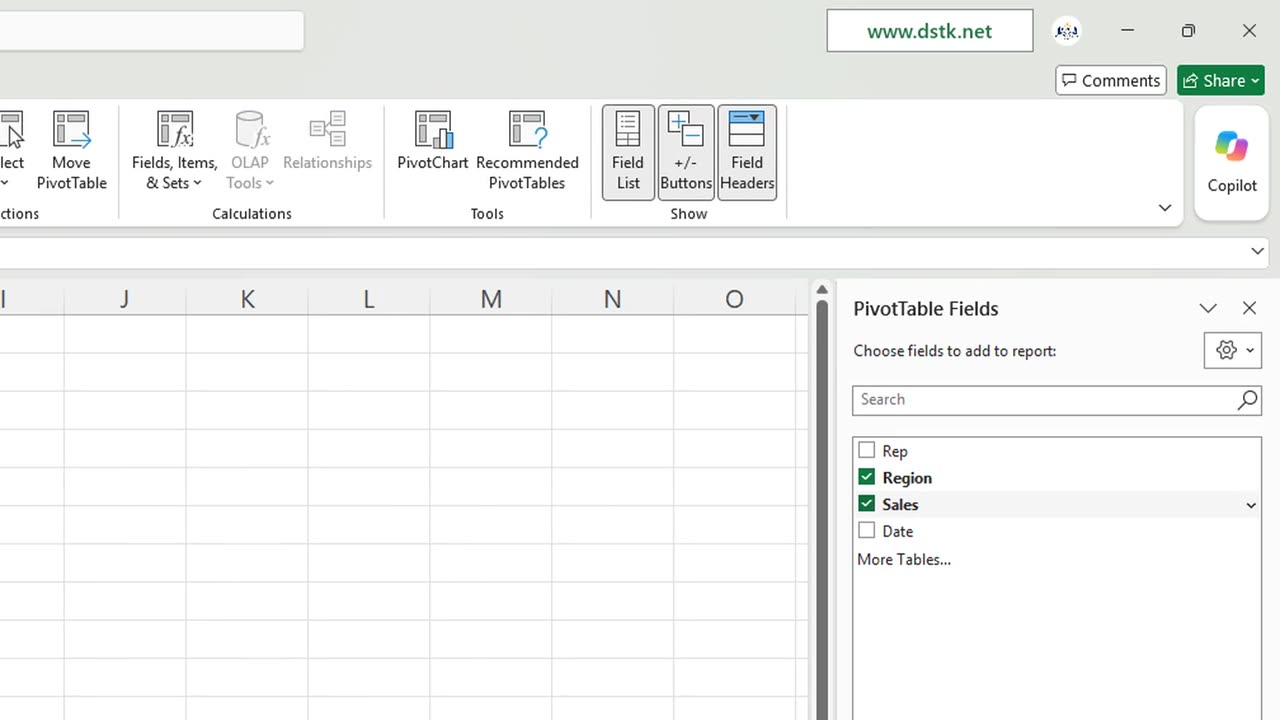
The numbers: Control and T, Enter, Alt, N, V, T, place it at F1, and tick Region and Sales.
Shortcut: Ctrl + T
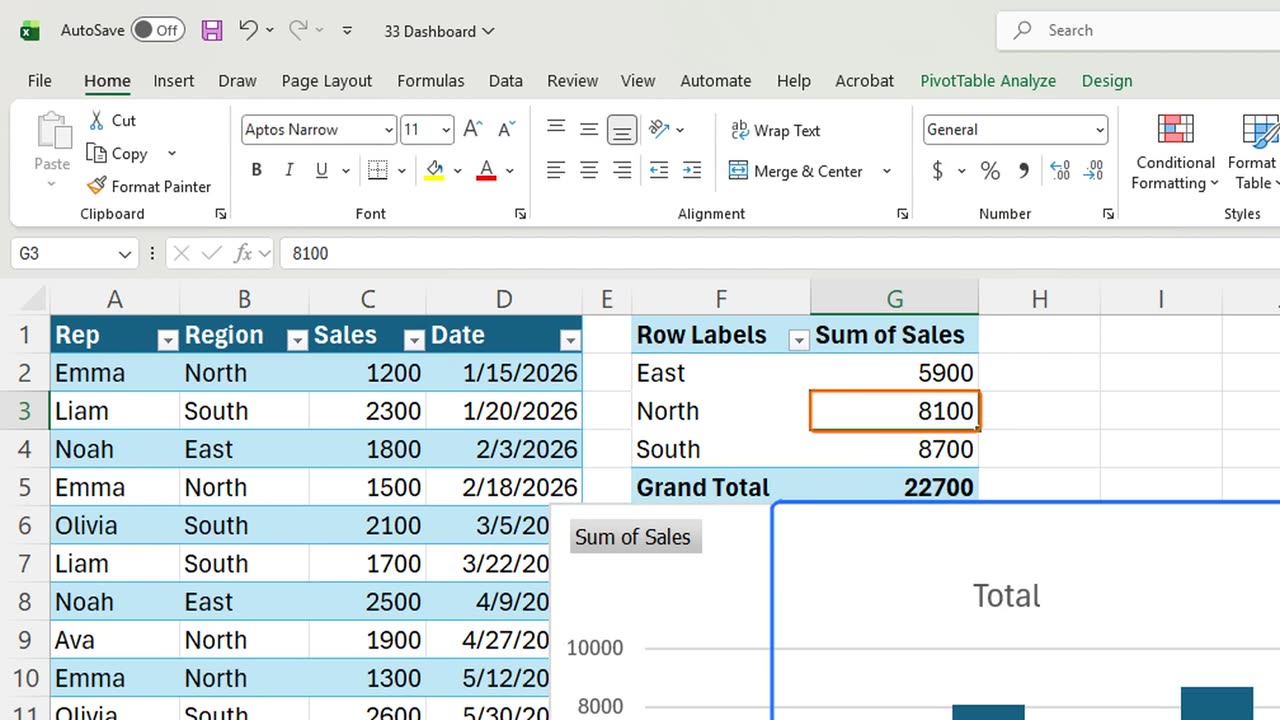
3. The picture
The picture: click inside the PivotTable and press Alt and F1. Because the source is a PivotTable, you get a PivotChart.
4. The clicks
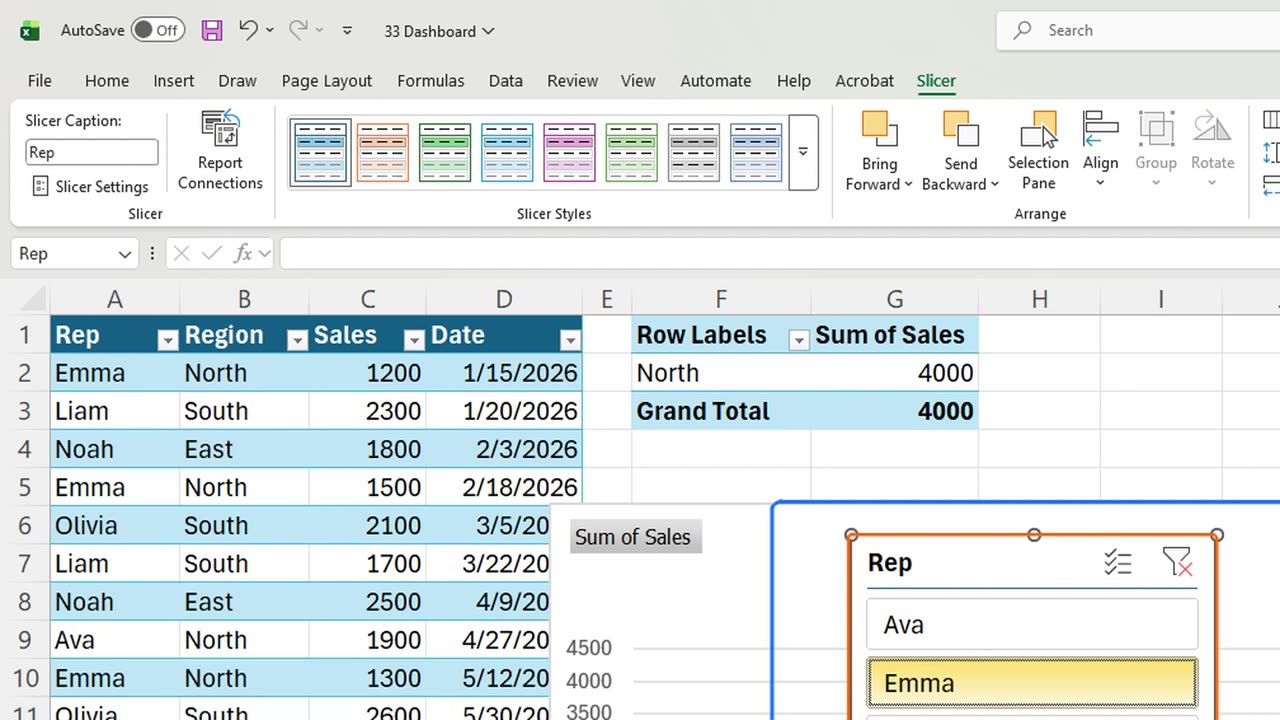
The clicks: with the PivotTable selected, Alt, N, S, F, tick Rep with Space, and Enter.
Click Emma. The table and the chart both change: Emma sells only in the North, four thousand.
Quick pause: if your first dashboard is taking shape, a like really helps the channel. Now let's make it look clean.
5. Clean it up
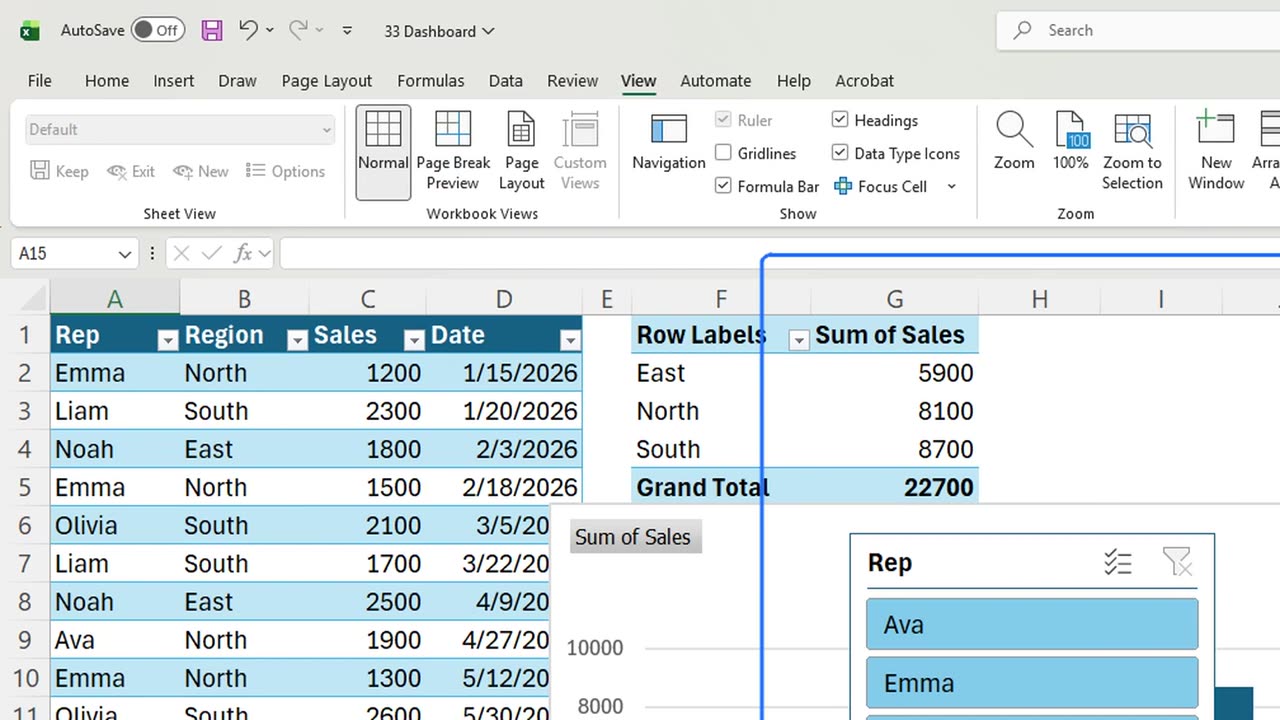
Clear the slicer, then turn off the gridlines: Alt, W, V, G. Without the grid, the page reads like a report, not a spreadsheet.
6. The refresh trap
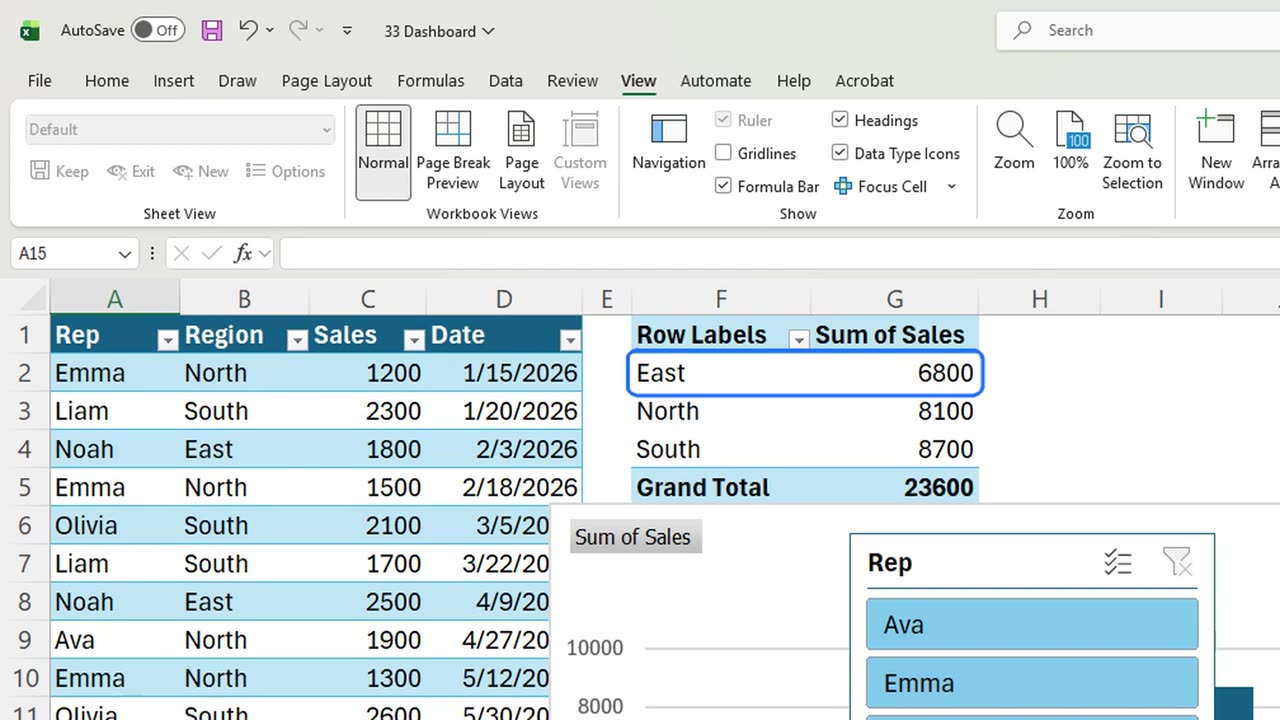
Now the trap. A new sale arrives: in A14 type Emma, East, nine hundred and a date.
The dashboard did not move. East still says five thousand nine hundred. Every PivotTable and chart is a snapshot until you refresh.
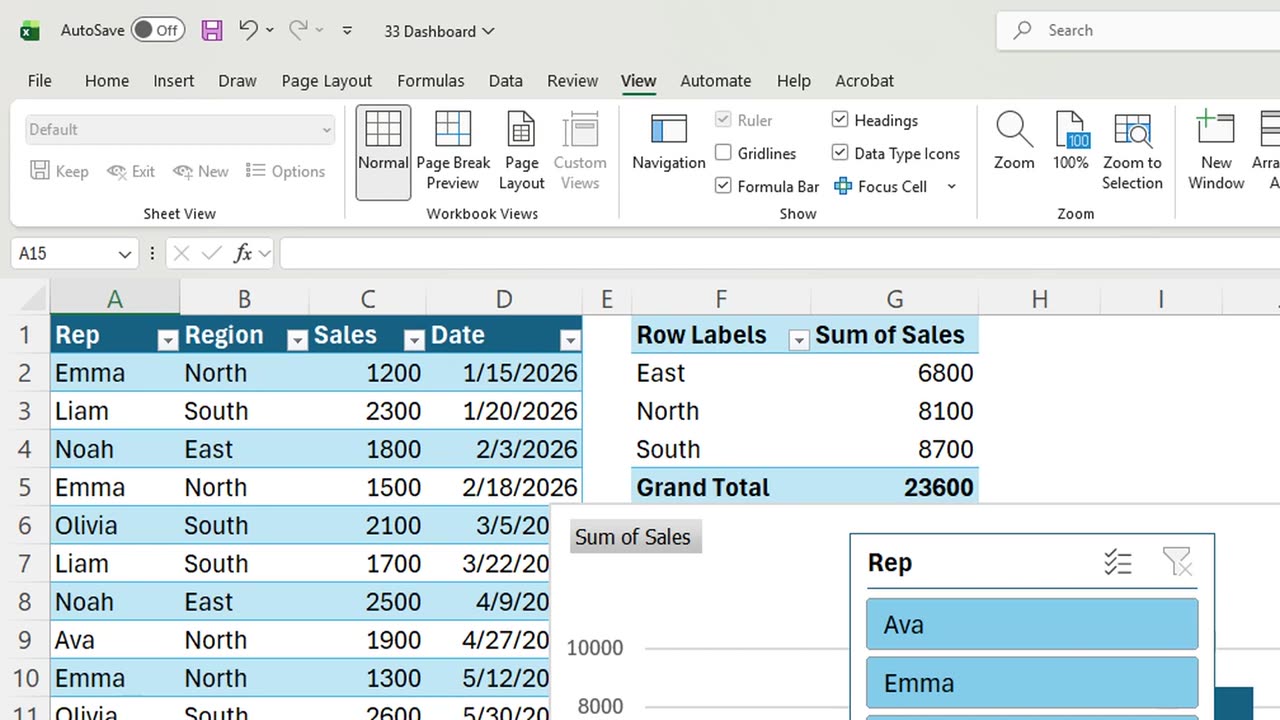
Press Control, Alt and F5. That is Refresh All: every PivotTable in the file updates at once. East is now six thousand eight hundred.
7. Recap
Recap: a PivotTable for numbers, Alt and F1 for a PivotChart, a slicer for clicks, gridlines off, and Control Alt F5 after new data.
In the next lesson, you will learn which chart type fits which question.
What would your first dashboard track: sales, budget, or something else? Tell me in the comments.
← Previous tutorial: Excel Slicers: Filter PivotTables with Buttons
Next tutorial: Which Chart Should You Use? (Excel Chart Types Guide) →